
When will my order arrive?
Know the average time for the customer's region and give a clear answer, even in the Q4 rush.
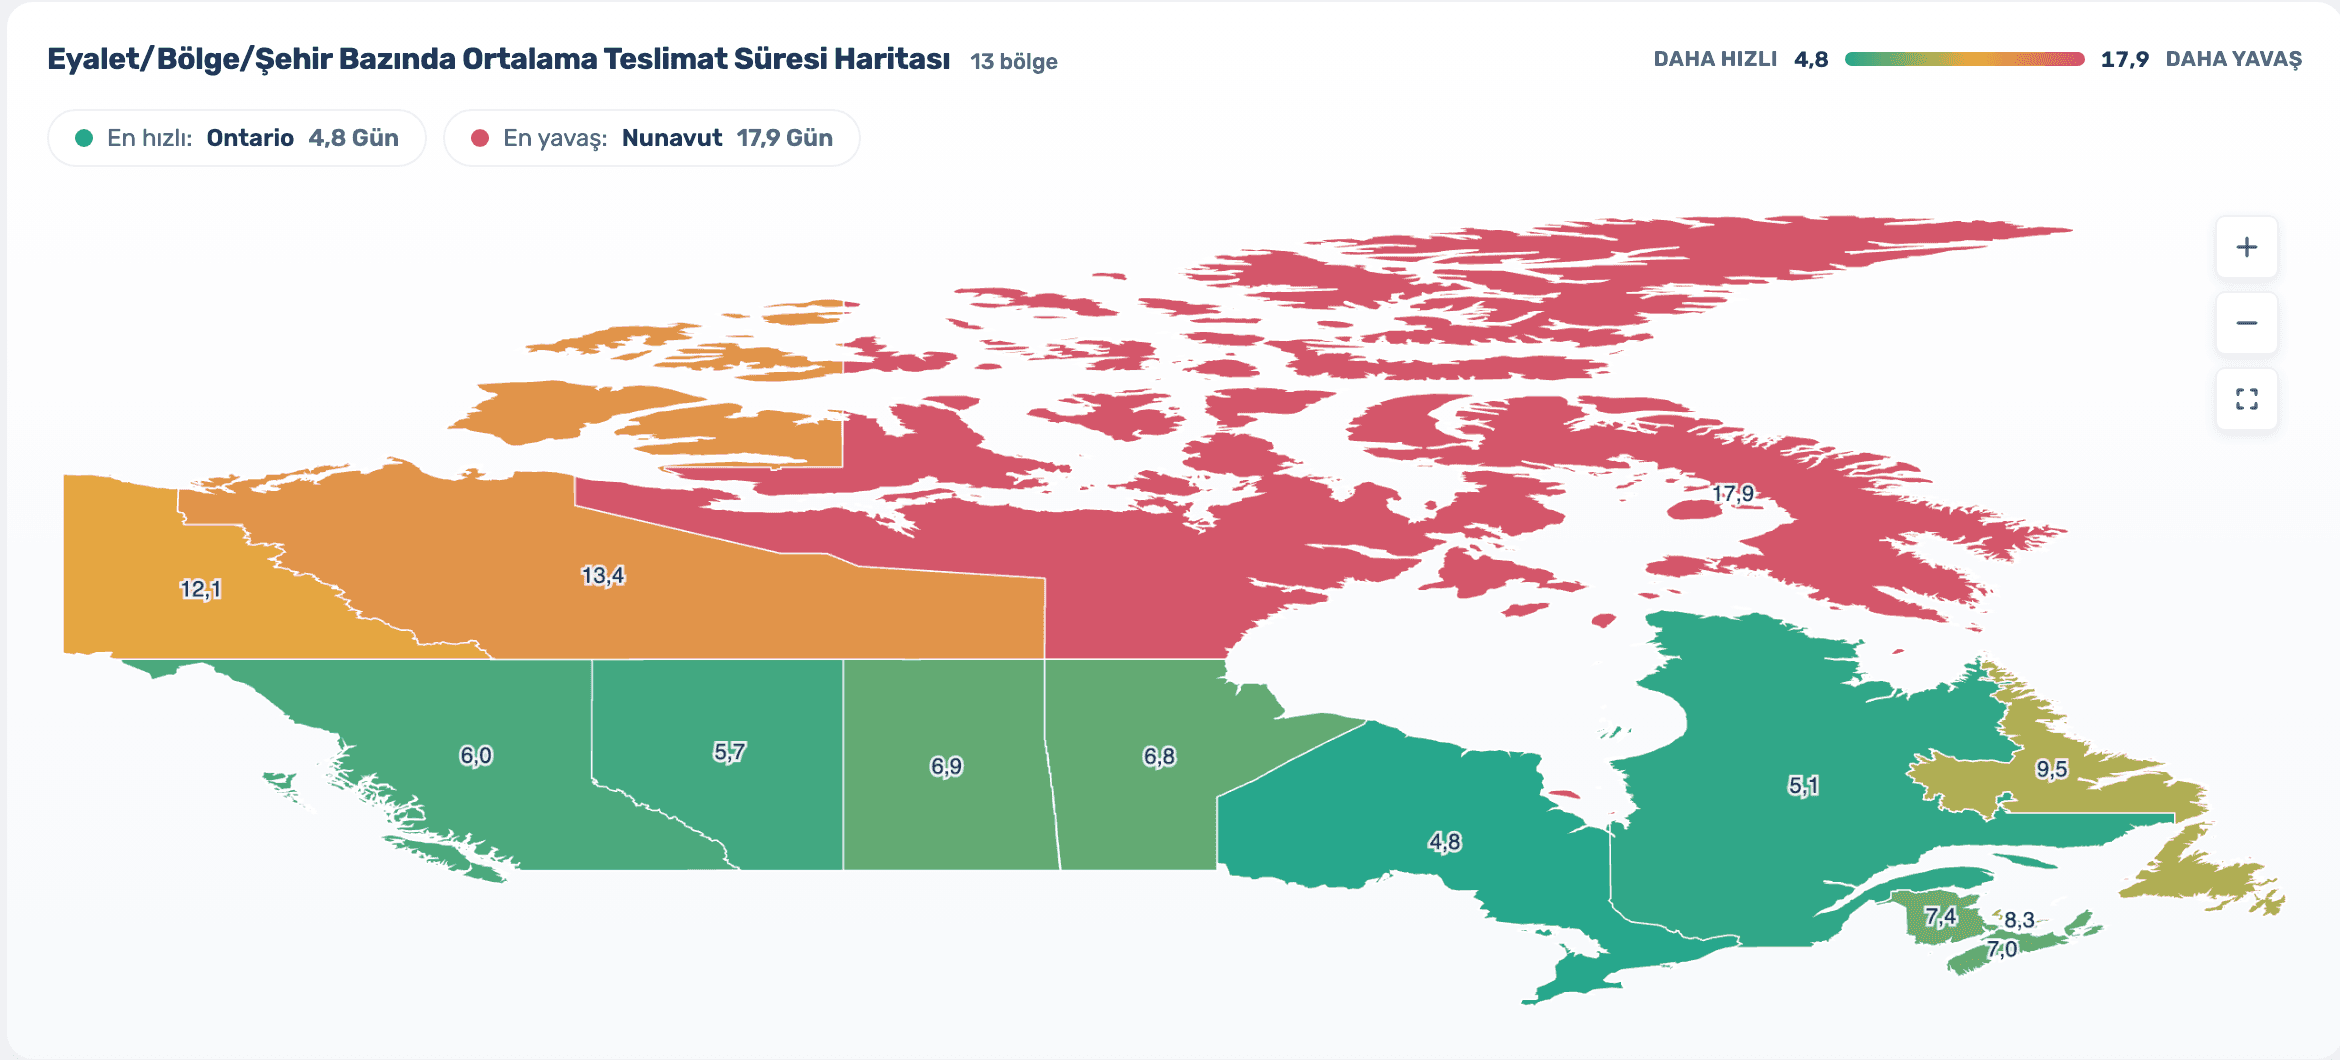
See average delivery times by state, region and city on a colored map. Compare the fastest carrier and warehouse, and plan your shipments on data instead of guesses.
Time is counted in calendar days from the day the parcel leaves the warehouse until it is delivered.
50% off your first month, code: MERHABA
Data in the screens is sample store data.
When will my order arrive?
Know the average time for the customer's region and give a clear answer, even in the Q4 rush.
Which carrier is faster?
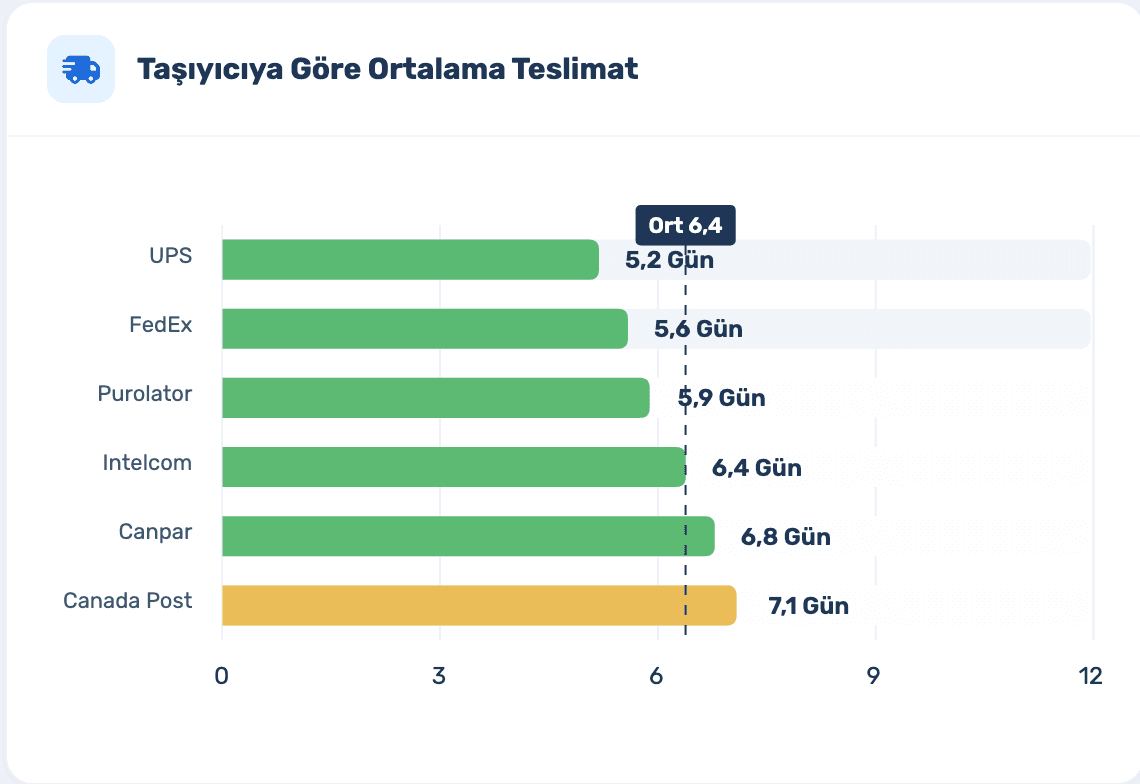
Carriers are ranked by average delivery time; the overall average line shows who falls behind.
Which warehouse should I ship from?
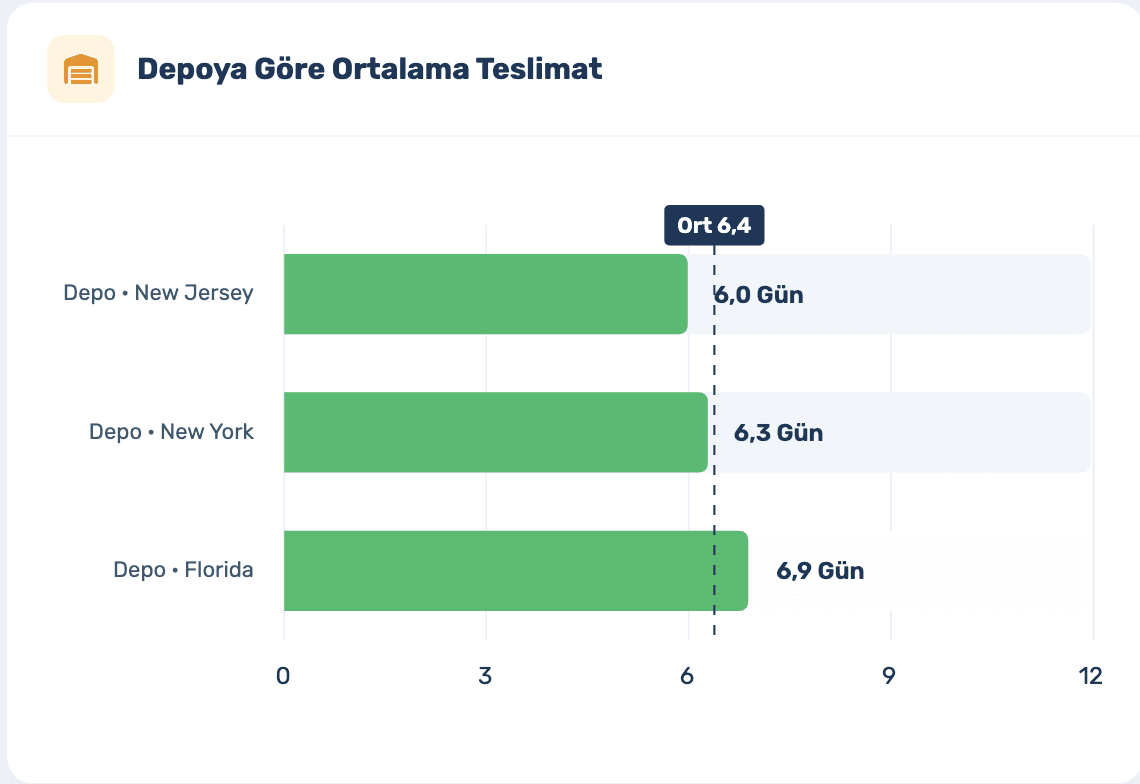
Compare your warehouses in one chart; the fastest shipping warehouse is shown on the summary card.
Where are deliveries delayed?
On the map green is fast and red is slow; the fastest and slowest regions are shown above it.
Sign up and connect your store; the report is built from delivered parcels automatically. Already a member? Log in and open it from the Orders menu.
Pick the period (1, 3 or 6 months, last year) and narrow down country, store and warehouse. Summary cards show the overall average, carrier and warehouse counts and covered regions.


Delivery times and data for all stores in that country. Gives you a clear picture of regions and carriers even if you have few orders.
Delivery times and data for your own store only. Shows the result of your own warehouse and carrier choices.
Average delivery times by carrier and by warehouse in separate charts. The dashed line is the overall average for the period; bar color tells the speed.
Sign up and connect your store; the report is built from delivered parcels automatically. Already a member? Log in and open it from the Orders menu.
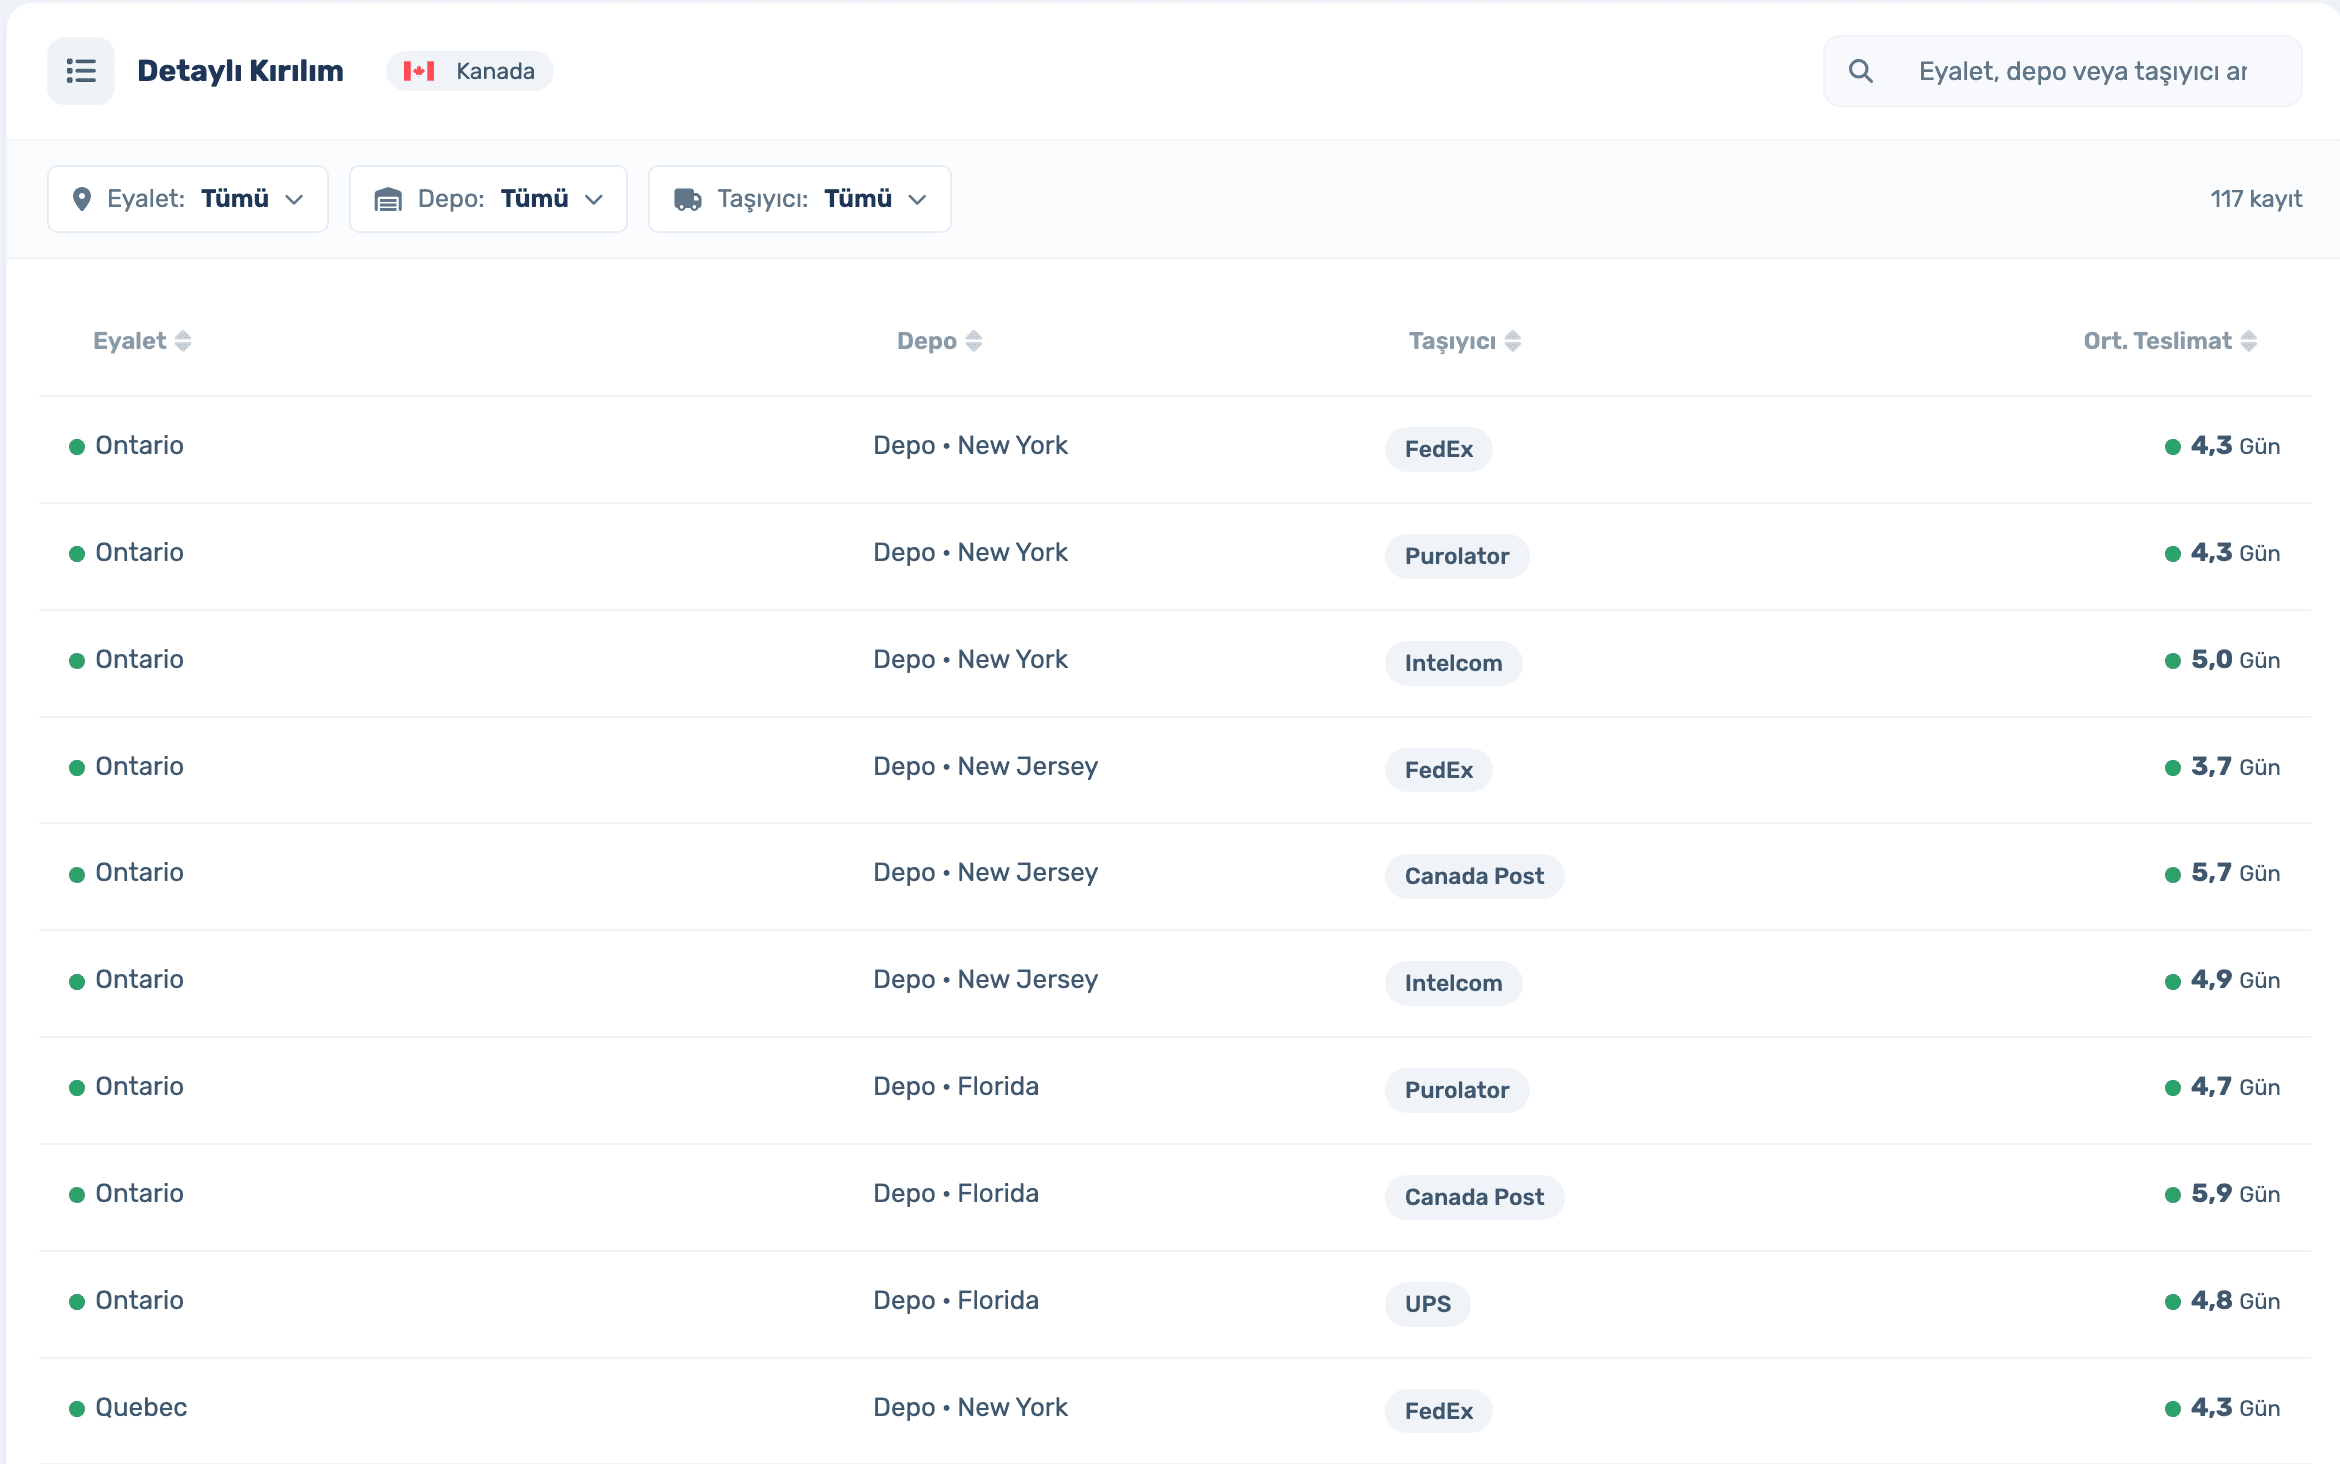
The average for every region, warehouse and carrier combination in one table. Search, filter, sort.
Late orders turn into returns or cancellations.
The longer customers wait, the lower your rating.
Delays show up in account health metrics. Choose carriers and warehouses based on data.
The map is available for Canada, Mexico, Japan, Australia, the UK, Germany, France, Spain, Italy, the Netherlands, Belgium, Ireland, Poland, Sweden and Turkey. In Singapore, the UAE and Saudi Arabia the charts and table work.
Sign up and connect your store; the report is built from delivered parcels automatically. Already a member? Log in and open it from the Orders menu.
Which region, which carrier, how many days: all in one report.
50% off your first month, code: MERHABA
Used EasyCentral before? 30% off to welcome you back: GERIDON